What is T Test?
T test is six sigma comparative method that provides confidence intervals for the manufacturing to make decision. To understand T test, central limit theorem and hypothesis test concept are very important.
Central limit theorem
If we repeatedly sample from a population and calculate the meaning of each sample, we can create a new distribution composed of these means. This distribution is called the sampling distribution of xbar. This is a new data set composed of x bar’s. These new data points have a mean and a variance, δ2xbar. A relationship exists between δxbar and the δx of the original population:
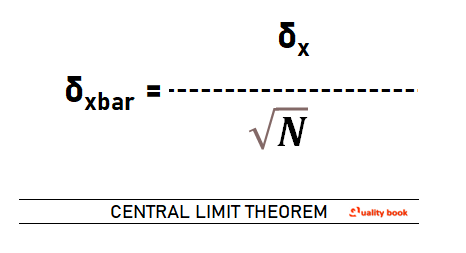
Where, n is the size of the sample taken from the population.
From this equation we can see that as the sample size taken from the population increases, the variance of the sampling distribution of the x ’s decreases.
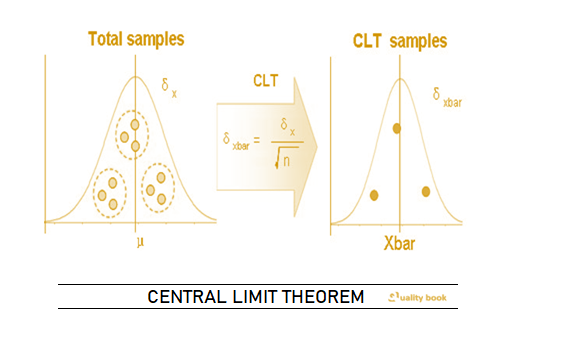
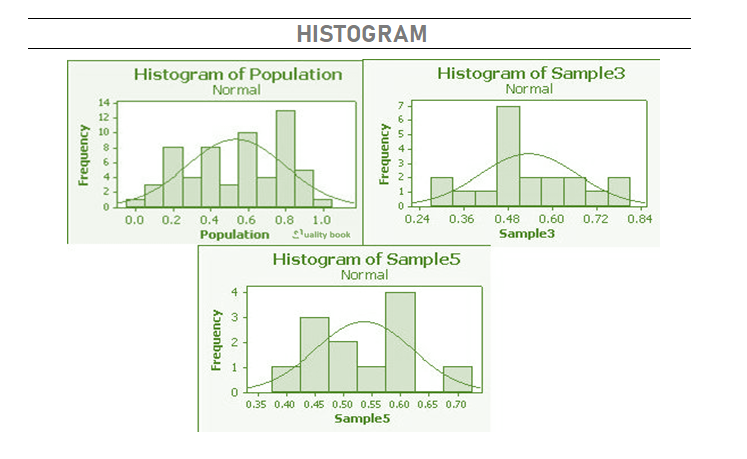
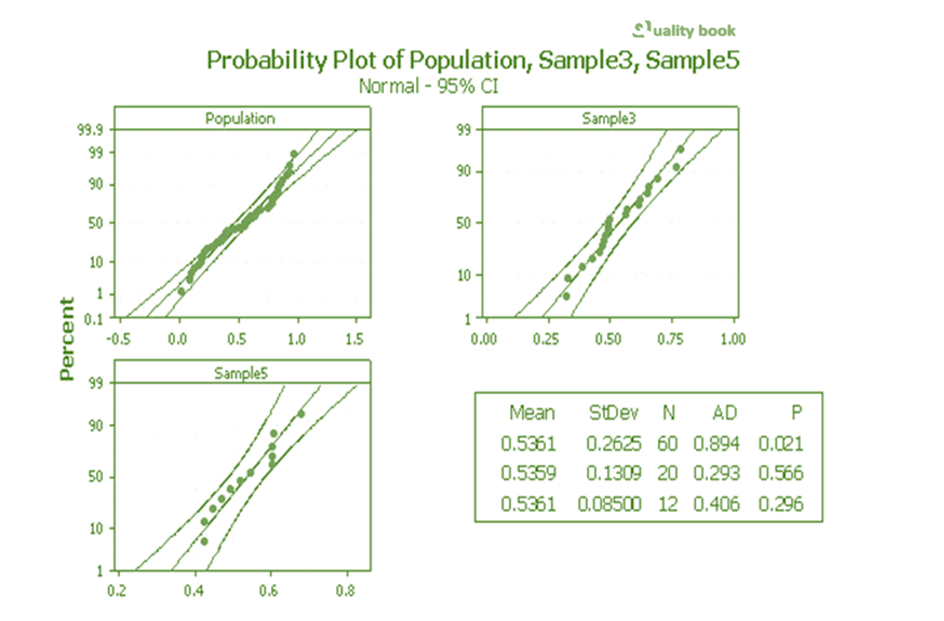
The Central Limit Theorem (CLT) states another important point about the sampling distribution of x : The sampling distributions of x ’s are approximately normally distributed.
As the sample size increases, the distribution of means comes closer to the normal distribution. Notice also how that as the sample size increases, the distribution of sample means gets tighter.
One to Standard T Test
To compare the process and standard. Find whether the process is same, greater, or smaller compared to standard based on 95% confident level. To confirm the process, below two observations are apply.
- Observed that the resulting p-value and α. Reject the null hypothesis, accept the alternative hypothesis.
- Observed that the resulting p-value and α. Fail to reject the null hypothesis. we do not have evidence proving that Ho is true.
Basically there are two type of Test which are two side test and one side T-test. However, One side T-test can be either left side T-test (smaller) or right side T-Test (greater).
1. Two side T-Test: Check on Process A = Standard Process
Comparison Statement: Ho: μA=standard ; Ha: μA≠standard
1. Observed that the resulting p-value < α/2. Reject the null hypothesis, accept the alternative hypothesis.
2. Observed that the resulting p-value > α/2. Fail to reject the null hypothesis. we do not have evidence proving that Ho is true
2a. One side Test: Check on Process A ≥ Standard Process
Comparison Statement: Ho: μA=standard ; Ha: μA < standard
2b. One side Test: Check on Process A ≤ Standard Process
Comparison Statement: Ho: μA=standard ; Ha: μA > standard
1. Observed that the resulting p-value < α. Reject the null hypothesis, accept the alternative hypothesis.
2. Observed that the resulting p-value > α. Fail to reject the null hypothesis. we do not have evidence proving that Ho is true.
Two sample T Test
To compare two process. Find whether the two process is same, greater or smaller compare to standard based on 95% confident level. To confirm the process, below two observation are applied
1. Observed that the resulting p-value and α. Reject the null hypothesis, accept the alternative hypothesis.
2. Observed that the resulting p-value and α. Fail to reject the null hypothesis. we do not have evidence proving that Ho is true
Basically there are two type of T-test which are two side test and one side test. However, One side test can be either left side test (smaller) or right side T-Test (greater).
1. Two side T-Test: Check on Process A = Process B
Comparison Statement: Ho: μA=standard ; Ha: μA≠μB
1. Observed that the resulting p-value < α/2. Reject the null hypothesis, accept the alternative hypothesis.
2. Observed that the resulting p-value > α/2. Fail to reject the null hypothesis. we do not have evidence proving that Ho is true
2a. One side Test: Check on Process A ≥ Process B
Comparison Statement: Ho: μA=standard ; Ha: μA < μB
2b. One side Test: Check on Process A ≤ Process B
Comparison Statement: Ho: μA=standard ; Ha: μA > μB
1. Observed that the resulting p-value < α. Reject the null hypothesis, accept the alternative hypothesis.
2. Observed that the resulting p-value > α. Fail to reject the null hypothesis. we do not have evidence proving that Ho is true.