Pre-Control Charts | Pre-control is a technique that can be used with X-bar and R, (Range), control charts. For example, for revealing process situations and variations that could produce defects (opposed to variations which are statistically noteworthy), and establish control limits without the using the normal calculations that are used with Upper control limits and Lower control limits.
When using Pre-Control Charts, start with a process centred between specification limits and attempt to identify movement that could produce some of the process parts being outside a print limit specification. Pre-Control Charts does not involve plotting and/or calculations and requires only three-piece parts to provide control information.
Assumptions Pre-control charts
The technique assumes a normal distribution curve to identify important variations within the spread of a production process that may produce an increase in defects in the production’s process.
The theory of Pre-Control Charts can be demonstrated by making the assumption of a worst case condition that could be tolerated from a process’s capability. In other words, when the normal tolerance matches what the print would allow, and when the process is exactly centred, any shift in the process would result in some defective work.
Control Limits
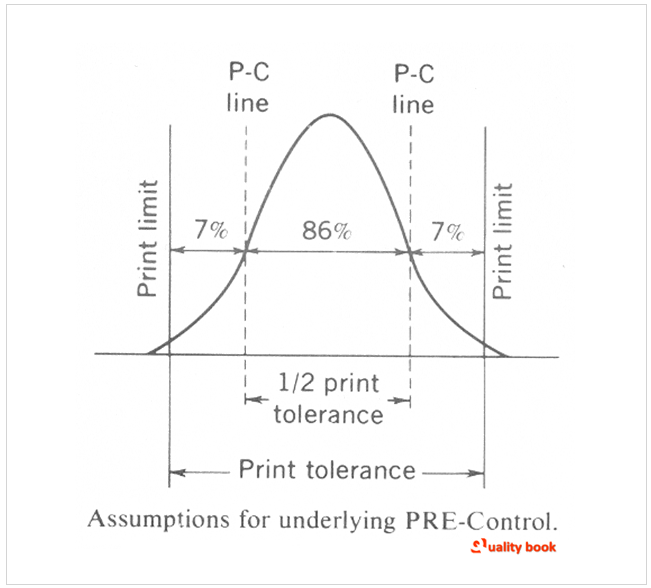
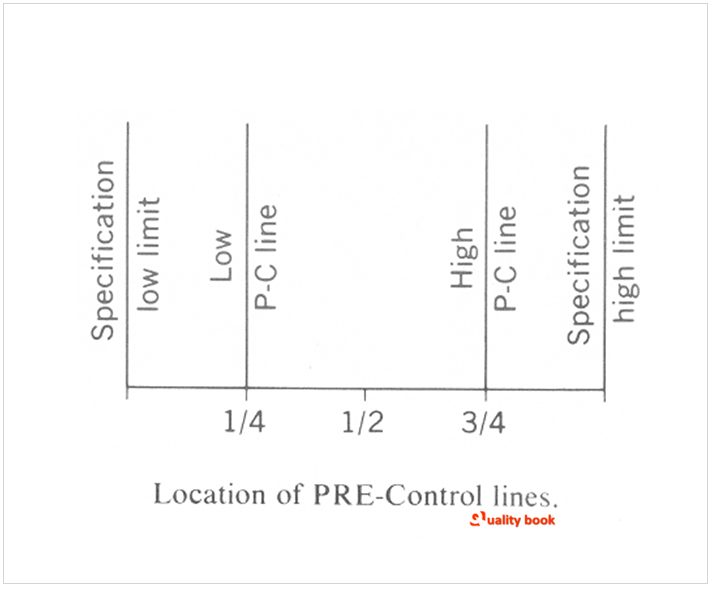
To set the control limits you should draw in two Pre-Control (PC) lines, each one quarter of the way inside of the specification limits. (Figure 1) As you can see, 86% of the piece parts should be within the PC limit lines, with a delta of 14%, 7% in from the specification limits. In other words, roughly 1 part in 14 could fall outside of the established PC lines in any typical conditions.
Descriptions
The chance that two parts in a row will fall outside a PC line is 1/14 x 1/14. This should mean that only about one in every 200 pieces or so could be expected to have 2 piece parts consecutively in a row within the given outer bands.
If 2 consecutive piece parts are in a row, there may be a much larger probability, 195/196. That the process may have been shifted.
PC lines
It is therefore recommended that one should reset the process’s centre at that point. It is also just as unlikely that any given consecutive piece part could go beyond one of the established PC lines. In such a case, it could indicate that the process may have been shifted. But not due to natural variation and that some other factors may have been introduced. Which resulted in a wider pattern to the point that defective pieces could be expected. If the latter is the case, then an immediate fix of the problem should be made prior to the process continuing to operate safely.
Techniques of Pre-Control Charts
The above theory should lead us to the following set of rules, (see note at end of page), that sums up the technique of Pre-Control Charts:
|1| Divide the specification tolerance range with PC lines at 1/4 of the acceptable tolerance as shown in the illustrations.
|2| Start the process.
Specification limits,
|3| If any piece part falls outside the specification limits, then reset the control limits as prescribed above.
|4| If only 1 piece part is within the specification limits. But outside a PC lines, check the next consecutive piece part.
|5| If second piece part also falls outside same PC line, then reset the control limits as prescribed above.
|6| If the second consecutive piece part is within the PC line, you should continue the process and reset the control limits as prescribed above, only when two consecutive pieces in a row fall outside the established PC lines.
Variation
|7| If two consecutive pieces show one to be outside the high PC line and one below the low PC line, you should take action immediately to decrease the variation.
|8| When five consecutive pieces fall between the PC lines, then frequency gauging may start. While waiting for the five pieces. If one piece goes over the established PC lines. You should start the count all over again.
|9| While frequency gauging, you should let process alone until a piece goes beyond the established PC lines. Then inspectthe very next piece part and proceed as in 6 above.
|10| When the machine has been reset, five consecutive piece parts within the established PC lines must again be produced prior to returning to frequency gauging.
Inspect
|11| If an operator inspects 25 or more times without the need to reset, the gauging frequency could be reduced so that more piece parts are produced between inspections. However, if the operator must reset before the 25 inspections are made, you should raise the gauging frequency. On average, 25 inspections are required to indicate that the gauging frequency is accurate.
This Pre-Control theory should point to variations within any process’s aim. It is easy to employ, can use go/no go gauges. And can assure a specific percentage of defective piece parts. When tweaks are made to the process as necessary.
As Model
Pre-Control Charts is an illustration of the model also known as narrow-limit gauging. The broader theory offers sampling procedures to link a predefined possibility of accepting bad piece parts. Many quality experts have argued about the theory. You should also investigate an acceptance control chart that would consider both consumer and producer chances.
The set of rules applies only when 1% to 3% defective is allowable. The six-sigma process spread is no more than 88% of any given tolerance range. You should also check for other rules that cover special quality levels and process spreads.