Six Sigma Statistical Framework | Despite the fact that knowledge of statistics is not the main point of the concept of “Six Sigma”, the name came from the subject of statistics.
Any process can be represented in the form of a mathematical model. Where the main parameters of the result of the process are the average value and standard deviation.
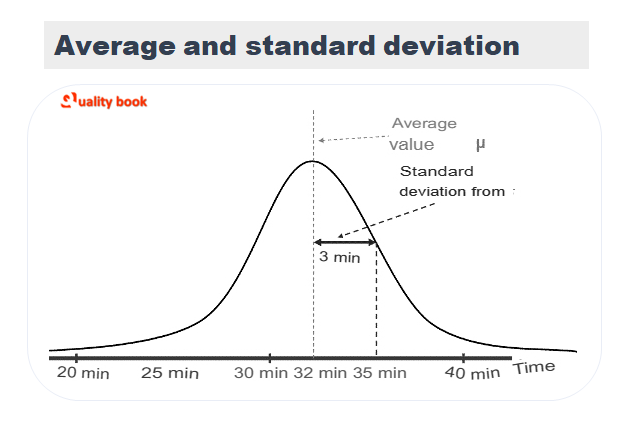
The average parameter answers the question of how the process works on average and is indicated by the symbol μ (mu). The standard deviation indicates the degree of variability of the result of the process and is indicated by the symbol σ (sigma).
The initial premise is the complete randomness of deviations, i.e. the absence of systematic reasons leading to a shift in the result. In this case, the distribution of deviations near the average value of the process will be well approached (in most cases) to the normal distribution. (Fig. 1).

Geometrically, a good visual picture is obtained by considering the density of the normal distribution.
Where the average is the peak of the density of the distribution, and the standard deviation is defined as the distance between the average value and the inflection point of the curve (Fig. 2).
Properties of the normal distribution:
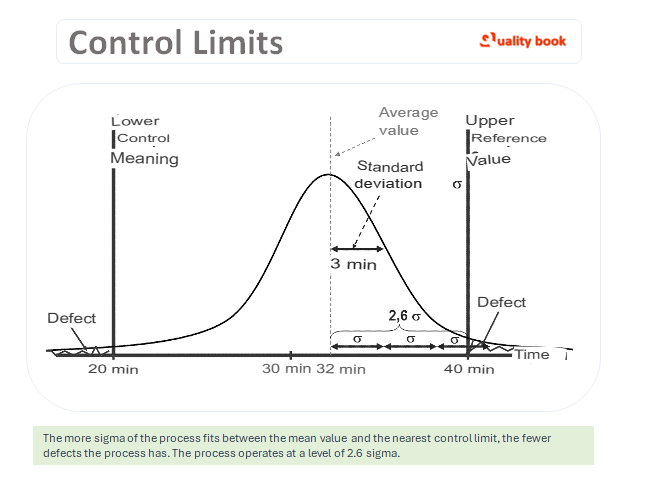
If some control limits are set for the process, exit For which the result of the process is considered an undesirable event. The more sigma of the process fits between the average value and the nearest control limit. The fewer defects the process has, which is clearly visible in the picture (Fig. 3).
The level of operation of the process is determined by the number of sigmas that fit into a given interval. The lower the standard deviation value, the more stable and better the result (provided that the average value is close to the target value).
It is known from the statistical justification that at a process level of 4.5 sigma. Out of a million units of production.
There will be no more than 3.4 defects, and this condition is met for stable processes. Under the present conditions.
The behavior of the processes can change with the time of year, the time of day, etc. (Fig. 4).

Based on empirical data, the researchers concluded that the deviations of the process caused by its natural instability give quality deviations of 1.5 sigma.
Thus, if the target quality level is 4.5 sigma (3.4 defects per million capabilities). Then taking into account the reinsurance of 1.5 sigma for deviations.
It is necessary to ensure a quality level of 6 sigma.

Conversion table % to Sigma levels accounting for 1.5 sigma shift and NAMW:
| % | Sigma Levels | Defects per million Opportunities | % | Sigma Levels | Defects per million Opportunities | |
| 99.9997 | 6.00 | 3.4 | 93.3200 | 3.00 | 66800 | |
| 99.9995 | 5.92 | 5 | 91.9200 | 2.90 | 80800 | |
| 99.9992 | 5.81 | 8 | 90.3200 | 2.80 | 96800 | |
| 99.9990 | 5.76 | 10 | 88.5000 | 2.70 | 115000 | |
| 99.9980 | 5.61 | 20 | 86.5000 | 2.60 | 135000 | |
| 99.9970 | 5.51 | 30 | 84.2000 | 2.50 | 158000 | |
| 99.9960 | 5.44 | 40 | 81.6000 | 2.40 | 184000 | |
| 99.9930 | 5.31 | 70 | 78.8000 | 2.30 | 212000 | |
| 99.9900 | 5.22 | 100 | 75.8000 | 2.20 | 242000 | |
| 99.9850 | 5.12 | 150 | 72.6000 | 2.10 | 274000 | |
| 99.9770 | 5.00 | 230 | 69.2000 | 2.00 | 308000 | |
| 99.9670 | 4.91 | 330 | 65.6000 | 1.90 | 344000 | |
| 99.9520 | 4.80 | 480 | 61.8000 | 1.80 | 382000 | |
| 99.9320 | 4.70 | 680 | 58.0000 | 1.70 | 420000 | |
| 99.9040 | 4.60 | 960 | 54.0000 | 1.60 | 460000 | |
| 99.8650 | 4.50 | 1350 | 50.0000 | 1.50 | 500000 | |
| 99.8140 | 4.40 | 1860 | 46.0000 | 1.40 | 540000 | |
| 99.7450 | 4.30 | 2550 | 43.0000 | 1.32 | 570000 | |
| 99.6540 | 4.20 | 3460 | 39.0000 | 1.22 | 610000 | |
| 99.5340 | 4.10 | 4660 | 35.0000 | 1.11 | 650000 | |
| 99.3790 | 4.00 | 6210 | 31.0000 | 1.00 | 690000 | |
| 99.1810 | 3.90 | 8190 | 28.0000 | 0.92 | 720000 | |
| 98.9300 | 3.80 | 10700 | 25.0000 | 0.83 | 750000 | |
| 98.6100 | 3.70 | 13900 | 22.0000 | 0.73 | 780000 | |
| 98.2200 | 3.60 | 17800 | 19.0000 | 0.62 | 810000 | |
| 97.7300 | 3.50 | 22700 | 16.0000 | 0.51 | 840000 | |
| 97.1300 | 3.40 | 28700 | 14.0000 | 0.42 | 860000 | |
| 96.4100 | 3.30 | 35900 | 12.0000 | 0.33 | 880000 | |
| 95.5400 | 3.20 | 44600 | 10.0000 | 0.22 | 900000 | |
| 94.5200 | 3.10 | 54800 | 8.0000 | 0.09 | 920000 |