Flowchart is a type of pictorial diagram, which shows each step of work processes and systems in symbolic form with brief description step by step. This chart is called a “flowchart” because of its symbolism, as it shows the direction of flow of processes through symbols. This diagram shows all the steps of the processes with pictorial, concise information, and directional arrows, so that even complex processes can be clearly and easily understood.
How flowchart looks like?
There are different types of flow diagrams for each business, document, product, process, and system. It depends on whose diagram you are drawing. But the structure of any diagram is the same. However, there are four common types of flowcharts:
What is a flowchart?
- The flow chart of the system shows all resource level steps associated with the processes.
- Program Flowchart: Shows the controls in a program inside a system.
- Document Flowchart: Shows controls on document flow through a system.
- Data Flowchart: Shows the controls on the data flow in the system.
In fact, a flow diagram is a visual representation of a process by sequencing the steps required and the decisions taken by the manager. Each process step within the diagram is described in sequence by a certain symbol. And the process or next process related to them is marked with arrow. The process is followed logically from start to finish in this chart.
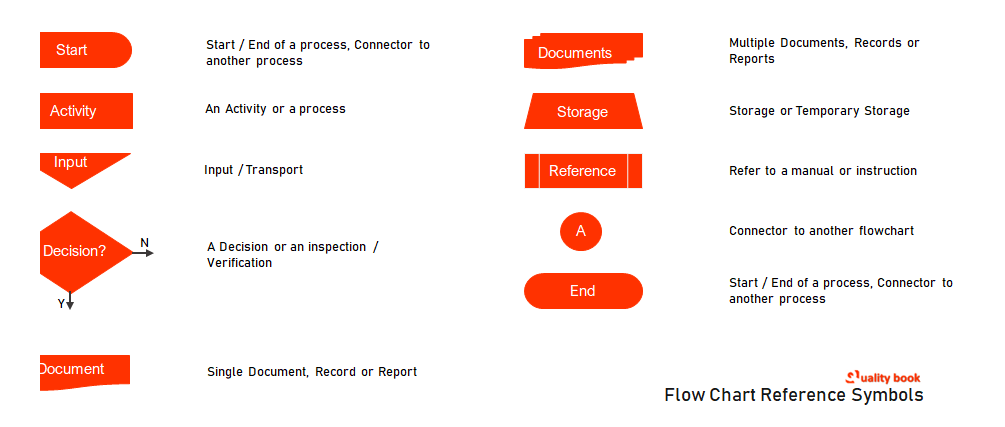
Common flowchart symbols
Any process or system is divided into various vertical or horizontal parts, then the control of organizational units is described, the symbol appearing in a particular part represents the control of that organizational unit. Some important symbols of flowchart:
Liquidator:
Shape: Oval
What does it look like? – Can indicate the beginning or the end?
Process:
Shape: Rectangle
What does it look like? – shows typical process flow steps?
Decision:
Shape: Diamond
What does it look like? – particular decisions of a branch or step in the process flow?
Adder:
Shape : Round
What does it look like? – Bounce in process flow
Data:
Shape: Quadrilateral
What does it look like? Represents data input or output to a process.
Document:
Size :
What does it look like? – denotes a document or report?
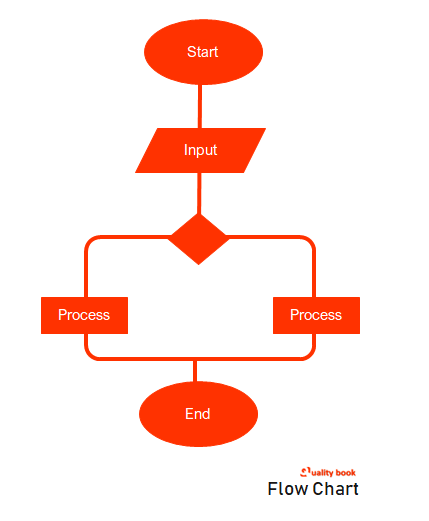
Flowchart Symbol Example
As you see the picture on the above, it is an example of a flowchart, in which all the necessary symbols have been tried to be included in the flowchart. These symbols are commonly used in flow charts.
Oval.
At the top you can see the start – oval shape, it shows the start and end of the process. This shape is probably used inside every chart.
Right angle.
The right-angle shape you have seen on the second number shows the ongoing processes. In this, any activity can also be shown with this figure. Especially the product manufacturer – has been able to present various departments, processes, and other activities.
Equilateral.
It is naturally used to denote materials, manpower and other input items, so that the reader can easily understand that it is focusing on the inputs in the process. In many cases, this rhombus shape is used to represent transport – that is, the movement of goods or other objects from one place to another – to represent transport.
Diamond.
This figure represents the rhombus or diamond managers, the decisions taken by the departmental manager. It is natural that some decisions need to be made in between processes when product quality and other requirements have to be taken care of. In some cases, this figure is Inspection and Verification – meaning – for the quality and verification of the product – which is consolidated between the two processes for checking the quality of the product, so that the quality of the product can be ensured.
Document.
This shape represents a single record or report.
Multiple documents.
When you want to show more than one document, you can use this figure.
Trapezium.
Be it any production process, the goods have to be kept at some place, when it comes to physical things, the goods and other products have to be stored, so this shape represents – permanent or temporary storage.
Reference page.
Naturally, this shape probably displays work instructions or manuals, which indicate that any process should be done according to work instructions and manuals, so that the quality of the product and the needs of the customers can be kept in mind…
Benefits of flowchart
Visual clarity
A flow diagram is a graphical representation of a process or document that can be easily understood. This is one of the biggest advantages. This tool makes it easy to visualize multiple progressions and their sequence in a document. So, managers or stakeholders in the organization can easily understand which step is unnecessary, which progress or processes need to be improved.
Effective communication
Although this equipment is suitable for any processes, it is especially used in product manufacturing areas. Flowcharts improve communication, such as any process iterations that can be improved.
When a change is made in a manufacturing process. So, an updated flow diagram allows everyone to easily see the change. It ensures how to be perfected in the overall production system. In other words, Clearly Articulating Progress provides an easy, visual method to help management members of the business quickly understand what they need to do step by step.
Effective coordination
If we talk about projects, for project managers and resource schedulers, the benefits of a flow diagram include the ability to sequence events and reduce potential for team members. It is natural that eliminating unnecessary steps can prevent the expenditure of time and resources.
Increase efficiency.
Work efficiency is of utmost importance for any product manufacturing sectors, which makes it easy to achieve increased efficiency from flow charts. Flowchart helps to easily list each step required to step through any process. and helps a designer identify and eliminate unnecessary steps and errors in a process. Only those steps should be included in the flowchart that are requirements to reach the end point of the process.
This makes the analysis effective.
The speciality of the flow chart is that it can easily and efficiently present any process and document through graphical presentation. This helps the managers to analyze the problem more effectively. Actually, this diagram – product processes or any number of processes shows specifically what kind of action is required by each step in the process.
Typically, in a flowchart, a rectangle with rounded edges defines the beginning or end of a process. A diamond shape shows the point at which a decision is needed. A square block represents the action taken during the process. A flowchart may also include symbols that show the type of media in which the data is stored. Similarly showing other symbols of collections, and processes makes the diagram easy to understand.
Helpful in problem solving.
Flow diagrams easily break down a problem into definite parts. The defined process represented by a flowchart demonstrates the method of solving a complex problem. A flowchart reduces the chance that an essential step in solving a problem will be skipped because it appears obvious. This is the simple and straight ways to reducing the cost as well wastage of time.
Documentation and Compliance
This is very useful whenever a problem arises. Because this chart makes it easy to trace all the steps of the process – or from one step to another – and society. This lets you easily identify when the problem occurred. The documentation of the process it provides is a significant advantage. A flowchart is appreciatively helpful to managers in the operational works, who are overseeing the various operations. Even it is very helpful to ensure the compliance with the company as well local bodies policy & regulations.
For example, managers may refer to a flow of accounting procedures to verify that those bookkeeping activities are being conducted in accordance with generally accepted accounting principles.
When should flowcharts be used?
- When you want to understand what the main steps of the process are and how it is done
- Most of the product manufacturing processes require continuous monitoring and improvement, then for the purpose of improvement, the study of the process is done.
- To document a process
- Especially for training, or for other needs – for the study of processes, which are made or understood about the process by communicating with others for the basic purpose.
- In product manufacturing areas, many departments, and employees work, then from one department to another department or one employee to coordinate with another employee – and for this purpose systematic and effective communication is done.
In fact, flow diagrams can be drawn for different processes, such as a manufacturing process, an administrative or service process, or a project plan. And this tool can be adapted for a variety of purposes. By the way, a flow chart is a picture of a process by placing it in a sequential order – the different steps. Which manager and departmental manager can get enough information for taking decisions and improvements in the process.