Six Sigma Methodology (or interpretation, “6 Sigma”) is become increasingly common in the practice of modern companies. This article provides an example of how to apply the technique “6 Sigma” at the stage when the business processes of the enterprise are described, graphical models are built, and their analysis is carried out for subsequent optimization.
Accordingly, the team working on the project needs a methodology for process analysis, planning and implementation of measures to ensure a consistent level of quality.
The term Sigma itself is statistical and denotes standard deviation, i.e., deviation. Ideally, you see your process without deviations, with constant quality at the output. In reality, deviations occur, and those that go beyond the acceptable level are called defects.
Concept
In concept “acceptable level” is the “highlight of 6 sigma”:
The maximum deviation of the output of the process should be 6 times less than the deviation that the consumer requires.
Hence the concept of Sigma quality: how many times the actual deviation fits into the tolerance specified by the consumer.
The initial levels of quality of Sigma correspond to hundreds and tens of defects per thousand, higher, fifth and sixth – tens and units per million.
(See Table 1) Purpose “6 Sigma” – increase the quality and reduce the number of defects. Thus, a reduction in costs is achieved (fewer warranty claims for quality), time is saved and the company’s position in the market is strengthened.
Table 1. Sigma levels
| Sigma Level | Number of defects per million | Number of defects per thousand | % of defects in total quantity |
| 6 | 3,4 | 0,0034 | 0,00034 % |
| 5 | 233 | 0,233 | 0,0233 % |
| 4 | 6210 | 6.210 | 0.6210 % |
| 3 | 66807 | 66.807 | 6.6807 % |
| 2 | 308537 | 308.537 | 30.8537 % |
Paradoxically, but the fact that the technique “6 Sigma” assumes the presence of defects, makes it the most effective tool for improving quality:
Instead of abstract concepts of total quality management, maximum customer satisfaction or defect-free production. It may propose to use a mechanism that regulates the definition of specific process indicators, their measurement, analysis, planning of improvement measures and control. The methodology is quite rigid and structured in implementation and uses a fairly extensive toolkit.
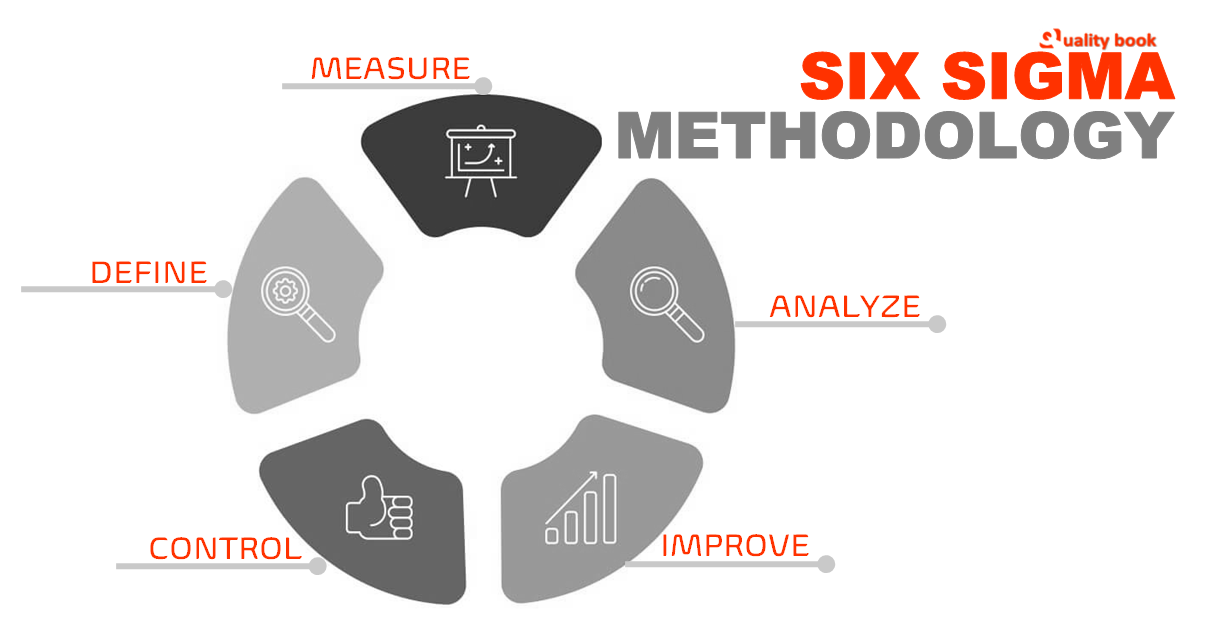
Without going into too much detail, I want to jump straight to one of the sequences. “Six Sigma Methodology”, used to improve the existing process, DMAIC: Define, Measure, Analyze, Improve, Control.
This limitation of the article is due to the fact that when trying to cover the entire technique “Six Sigma Methodology” material will turn out to be either too voluminous, or just a review, and therefore of little use. The process of applying the DMAIC sequence consists in performing a set of measures assigned to each of the 5 stages, according to the initial letters of the name.
An example would be the task of reengineering. business process “Training Center of the company Example Company”, one of the outputs of which is the Seminar.
Define. : Six Sigma Methodology
The main tasks of this stage are to determine who is the consumer of the process and its requirements, what goals it pursues and what results the project should bring.
For this stage, already developed process maps or level 1 models in IDEF0 notation are used on which It is possible to identify Suppliers, Inputs, Consumers and Outputs.
The basic recommendations for model analysis are as follows:
- Idle functions (works) must be eliminated or included in the process,
- Functions that do not lead to customer satisfaction also need to be eliminated. For example: fault correction that can be prevented, disposal of defective products, irrational delays. Liquidation involves combining several functions (works) into one to prevent delays, as well as identifying and correcting the causes that cause the need for alterations or disposal.
All the problems of process variability ultimately boil down to the inability to meet the needs of consumers.
To prevent these problems, it is necessary to identify the characteristics of the product or process and how they are measured. The characteristics of the Process Outputs and their importance to the consumer are recommended to be summarized in a table, see below for an example.
Characterization is necessary to focus on the most important activities and to facilitate the creation of a measurement scale to be used in statistical analysis. Examples of measuring scales can be consumer reviews, geometric dimensions, taste.
Table. 1. Matrix of process characteristics.
| Exit Process Training Center- Seminar | |||
| Output characteristics | Duration | Cost | Quality |
| Rating Specifications (1-10) | 1 | 5 | 10 |
| Factor affecting the characteristic and its rating (1-10) | |||
| Coach’s eloquence | 8 | 1 | 2 |
| Qualification of the coach | 5 | 7 | 10 |
| Rental price | 1 | 10 | 1 |
| … | |||
When creating a measuring scale, it is also recommended to use the Balanced Scorecard methodology, which monitors the performance of the company in several perspectives: Finance, Consumer, Process, Training and Growth. The most common indicators of the BSC methodology implemented in projects “6 Sigma” are presented in Table. 2.
Table. 2. Prospects and indicators of the process in the Balanced Scorecard methodology.
| Finance What are the financial objectives of the process?
| Customer What are the needs of the client in this process?
|
| Process What processes (in this case, we mean the processes of the 2nd and other levels of the model) contribute to meeting the needs of the client?
| Learning & Growth How qualified and innovative should the staff be?
|
The advantage of the Balanced Scorecard methodology is a structured approach first to the definition of goals, and then to the measuring scale itself, i.e., performance indicators of achieving the goal.
Measure – Measurement. : Six Sigma Methodology
At this stage of the sequence, it is necessary to determine the Process Defect and its causing causes by measuring those factors that have the greatest impact on the selected Characteristics. To select these factors, it is advisable to use a Pareto diagram, on which you can identify 20% of the factors that generate 80% of the problems.
The second statistical tool used at this stage is Control Charts. They allow you to assess the stability, therefore the predictability of the process. This is due to the fact that unstable (unpredictable) processes need to be stabilized before starting to improve. There are 2 sources of process instability: ordinary (existing constantly) and special (arising suddenly).
Control chart and allows you to identify special sources. The mechanism is very simple: we determine the average value, then the upper and lower control limits (usually 3 Sigma from the average). Points outside these limits will be particular sources of instability. There are several types of control charts, depending on the data type and purpose, see Table 3. You can carry out the process of building a control chart in Excel or Minitab.
Table 3. Control chart types.
| Diagram | Sampling type | Data type | Destination |
| R | Adjustable sample size | Proportion (relative number of defects | Analysis of process stability by counting the number of defects |
| nP | Sample size constant, 20-50 | Proportion | Analysis of process stability by counting the number of defects |
| with | Sample size constant, easy to count the number of defects | Numerical, very large sample size | Stability analysis for more than one defect per product |
| u | Convertible | Numerical | Stability analysis for more than one defect per product |
| XmR | Size -1 | Time, length, weight, money | Stability analysis for only one measurement, the results of which vary considerably |
| XbarR | Size 2-10 | It’s time | Estimating cycle times |
In many cases (production, technology), it is also necessary to find out whether this process is able to meet the needs of the client. In numerical terms, this ability is expressed as 0 defects. Striving for quality “6 Sigma”, we can take the upper control limit of 3.4, and the lower – respectively 0 defects per million. The process is considered “capable” if the schedule is in between control limits. Automation of this analysis (Capability analysis) is carried out in Excel, Minitab, etc.
We continue to explore the process training center and measure the Characteristics “Quality of the Seminar” (as the most important) by interviewing a group of customers and employees of the company for 3 months. The list of questions, answers and percentages are presented in Table. 4.
Table 4. for Six Sigma Methodology
| № | Question | Answer | % of total quantity |
| 1 | Reason for participation in the seminar | General introduction Gaining skills Level up Other | 22 45 20 13 2 |
| 2 | Did the seminar meet your expectations (1- no absolutely, 5- yes for sure) | 1 2 3 4 5 | 2 7 45 35 11 |
| 3 | Coach qualification (1-bad, 5-excellent) | 1 2 3 4 5 | 4 12 28 30 26 |
| 4 | Quality of the supplied material (1-bad, 5-excellent) | 1 2 3 4 5 | 8 36 30 20 6 |
| 5 | Time efficiency (1-bad, 5-excellent) | 1 2 3 4 5 | 13 33 34 16 4 |
| 6 | How can the seminar be improved? | Higher quality material More efficient use of time Professional development of the trainer | 47
35
18 |
| 7 | Do you plan to use our services in the future? | Yes No It’s possible | 62 20 18 |
Analysis and decision-making
The data collected as a result of the survey at first glance is quite enough for analysis and decision-making, but for this it is necessary to make sure that they are adequate. This means that if the respondents demonstrated consistency in the assessment of the characteristic, then there is a possibility that the results of the survey are suitable for further analysis.
We use attribute analysis of the measurement system (Gage R&R;) The Minitab package, which results in 65% of respondents being consistent in their assessment, and therefore this data can be used. The most important factors for the management of the Training Center are the loyalty of existing customers, their desire to buy other services (for example, consulting) and the attraction of new consumers. Therefore, we analyze the answers “No” to question No. 7.
The technical difficulty of the analysis lies in the fact that several experiments are conducted (here 20) with different sizes of focus groups and distribution of responses. Accordingly, it makes sense to analyze the proportional distribution of the response. “No” throughout the survey, which was implemented in Minitab, control chart type P, see illustration below.
For the manager, this graph carries information about the applicability of the results of the experiment to improve the process (the graph is within the red lines – each 3 Sigma from the center, therefore the process is stable) and the actual distribution of the response proportions. “No” to the question “Do you plan to use our services in the future?”
Analyze : Six Sigma Methodology
This stage requires the analysis of the results of activities by approving the criteria for assessing and investigating the causes of defects.
For our example, this is to construct a cause-and-effect diagram (Ishikawa diagram). Other types of research can also be carried out, for example, according to the FMEA (Failure Mode and Effects Analysis) model – the analysis of a defect and its cause, is used in the study of technological aspects of the process.
Improve- Improvement
The obvious task of this stage is the implementation of measures planned in the analysis of the causes of defects. The list of these measures in relation to our example is given in Table. 5. When solving technological issues, it is necessary to use the methodology of designing experiments (DOE- design of experiments in Minitab and Excel).
The essence of this statistical tool is to determine the optimal ratio of factors to achieve the highest quality. For example: the search for such a ratio of reagents, temperature, and duration of the process, in which the purity of the product will be the greatest.
Table 5. Measures to improve the quality of the seminar.
| Personnel |
| Conduct certification of coaches |
| Teaching |
| Conduct methodical classes with trainers |
| Conduct pre-sale testing of trainings |
| Process |
| Draw up job descriptions within the framework of the project to describe the process. |
Control
At the final stage of the DMAIC sequence, it is necessary to develop a plan for monitoring the improvement of the process by repeating statistical studies, determining and monetary evaluation of the effectiveness of the measures taken.
In our example, we again conduct a customer survey and analyze the distribution of negative responses by building a control chart, see Fig. 3. The proportional number of dissatisfied consumers decreased by approximately 50%, which gives the right to talk about the economic efficiency of the considered project “Six Sigma Methodology”.
Conclusion.
In this article, one of the sequences of the technique was considered “6 Sigma”, DMAIC and a review of statistical tools. Of course, the effective use of the methodology requires the involvement of qualified specialists or serious investments in the training of their own. In this regard, the manager should be clear about the range of tasks to be solved in the projects of the class. “6 Sigma” and a list of requirements for participants in these projects, taking into account the specifics of the enterprise.
The example in this article illustrates the effectiveness of the application ” Six Sigma Methodology ” to optimize almost any kind of process, provided that the objectives of the process are correctly defined and how to measure its key characteristics.
The author did not set out to describe the demonstration of advantages “6 Sigma” before any other approach to quality management or process reengineering. Nevertheless, I hope that the article will be an incentive for a deeper study of the methodology and its application in practice.
I am convinced that declarative statements about the effectiveness of a tool should be replaced by practical recommendations that stimulate the study of a particular direction or the use of professional services.