What is Measurement system analysis (MSA)?
Measurement system analysis(MSA): A process where statistical studies are being conducted to analyse the variation present in the results of each type of measuring and testing equipment system.
Now day, every organization is understanding importance and widely used measurement system to quantify the variation which is only way to measure output of a process. Generally, measurement data can help to ascertain and determine if a significant association exists between two or more variables, and analytical study is one of the important study & enhance information about the causes in existing processes, to explore such relationship of variations in manufacturing processes, mostly the defects or out of tolerance in measurement occurred due to measuring devices used in inaccurate, unstable or out of calibration.
What is Measurement system analysis (MSA)? || Purpose of the measurement system analysis (MSA) || MSA Process Map || Measurement variation & variable data || 5 Characterized / Statistical properties in MSA || Gage Repeatability and Reproducibility | Gage R & R || Gage R & R: Pre-Study || Gage R & R Study || (MSA) Measurement system analysis checklist || Conducting Gage R & R Study || Analyzing Gage R & Results || Repeatability versus reproducibility || Gage R & R Graphic Analysis || Measurement system analysis applications
List of Abbreviations
| KEYWORD | ABBRAVIATION |
|---|---|
| MSA | Measurement System analysis |
| G R & R | Gauge repeatability and reproducibility |
| USL | Upper Specification Limit |
| LSL | Lower Specification Limit |
| TV | Total Variation |
| EV | Equipment variation |
| AV | Appraiser Variation |
| PV | Percent Variation |
Purpose of the measurement system analysis (MSA)
Simply, to quantify variation in measurement system. The purpose of measurement system analysis is to quantify a measurement system for use by quantifying it stability, accuracy and precision.
The advantage of using a data based practice is basically determined by the quality of the measurement data used. To confirm that the assistance resultant from by means of measurement data is great sufficient to deserve the cost of attaining it, courtesy must be focused on the quality of the data.
Process Map: Table
| WHAT RESULTS (PROCESS INDICATORS) | BY WHAT? (EQUIPMENT, MATERIALS) | INPUTS | BY WHOM (PERSONAL) | HOW? | OUTPUTS |
|---|---|---|---|---|---|
| Testing and measuring equipment as per Lab Equipment List, Testing and Measuring Equipment Master List. | Measurement System (i.e. Gauges, Testing Facilities, etc) to be analyzed as per schedule or customer request. | As per Quality assurance department’s organization chart / Assignment of responsibility | Instructions, procedures, methods, techniques | Measurement System Analysis Report |
Measurement variation & variable data
Most measurement variation is adverse, but there are some significant exceptions. In case of minor changes in the characteristic being measured cause variation, it is usually considered desirable. Considerable variation in a bunch of measurements is due to the interaction amongst the measurement system and it settings. In case interaction of measurement system and its environment generating more variation, that quality of product considered as low.
To eliminate possibility of variation in existing measurement system needs to define some initial objectives like:
- Established the accuracy of the measurement system and the data.
- Understand measurement as a system which includes gauges, operators and environment.
- To quantify the variation present in the measurement system.
- Initiate appropriate action to minimize the contamination of measurement variation in overall process variation.
- Ensure the stability of the measurement system.
A Variable data is set of data that can be measured on a scale and also on a range. Generally, it is can have mostly in numeric values and be significantly split into smaller prats and still have meaningful for conduct analysis, it’s all upon the accuracy of the measurement system.
There are five characterized / Statistical properties in measurement system analysis:
(A) Accuracy
(B) Precision
In any manufacturing process of organization, measurement system can have of two type of problem of variation, first is accuracy and second is precision. Accuracy type variation have a measurement device that measures parts with very little variation, but is not pure accurate and precision type have an instrument where the average of the measurements is very large variance. See example:

(A) Accuracy
Accuracy states the difference between the measurements and the product’s actual value, it is called “Actual Value vs. Average measurement values”. The analysis conducted on based of known standards where absolute correctness of measurements is compared. All measurement processes will contain some amount of variation, and its generally raise by two sources, one is the difference between product made by any process and second is the method of attaining the measurement are inadequate. The accuracy of measurement system is generally evaluating by three components: (1) Bias (2) Linearity (3) Stability.
Bias
You may observe an average that is different than the actual process average. The difference is known as bias, its difference between the true or reference value and the observed average. The measurement system will also contribute some variability this variability comes from gauge and operator.
The reference values also considered, established reference values or master value that obliges as an agreed upon reference for measured values. In case of bias exists in the averaged measured values, the measurement system may need to calibration.

Gage BIAS Instruction – Gage BIAS Study
Acceptance criteria is “zero” must lie within Tbias limit
- Obtain accepted reference value for part.
- Use tool room or layout equipment.
- Measure same part minimum 10 times using gage under evaluation.
- Calculate average of readings.
- Calculate bias: Bias = observed average – reference value.
- Draw histogram, interpret for normality.
- Calculate sigma r = (max reading – min reading) / d2* (d2* is taken from appendix c, g is 1 and m = n)
- Calculate sigma bias = sigma r / sqrt n.
- Calculate t statistic for bias = bias / sigma bias.
- Calculate lower limit of t distribution of bias.
- Calculate higher limit of t distribution of bias.
Why Gage BIAS Study?
- Proportionally, not likely to be as large as R & R, but a factor that helps to quantify accuracy.
- Used in further analysis relating to stability and linearity of same gage.
- Accepted reference value should be same as other related statistical properties evaluations.
- May be compared later with readings of appraisers performing GR & R study (Xa, Xb, Xc).
Calculation:
- A : [+] CALCULATE SIGMA r = (Max Reading – Min Reading) / d2*, d2* is taken from Appendix C , g is 1 and m = n
- B : [+] CALCULATE SIGMA BIAS = SIGMA r / SQRT n
- C : [+] CALCULATE t STATISTIC FOR BIAS = BIAS / SIGMA BIAS
- D : [+] CALCULATE LOWER LIMIT OF t DISTRIBUTION OF BIAS
- E : [+] CALCULATE HIGHER LIMIT OF BIAS
Linearity
Linearity is the assets of a measured relationship describe graphical representation functionally as line manner. It’s a measure of the bias values through the complete range of measurements or Linearity used for represent difference in bias values through expected operating range of Gage (Process Variation). The Gage linearity and bias study mostly used to decide the gauge is measuring accurately or functionally accurate for measurement and the graphical display help to identify difference to easier for determine for analyser to compare the values, how accurate measurements are.
Generally, linearity graphically represents, how the measurement of item affects the accuracy of the measurement system and how much difference in the observed values through the expected range of measurement.

Method:
- Select more than 5 sample standards that covered measurement space, the sample parts that can be measured at different operating ranges of measurement system within process variation.
- Measurement sample standards at least 15 to 30 times.
- Determine reference value for each part using layout inspection
- Take the minimum 15 repeated measurements on each part randomly.
- Calculate the average of the reading.
- Calculate BIAS for each observation (BIAS = Observed value – reference value)
- Plot Bias average and individual bias (Axis – Y) Against reference value / Master value (Axis – X) using Excel spread sheet. (1) Scatter Plot (2) Linearity represented by slop of best fit line on these points).
- Calculate lower and upper end of bias, Calculate linearity and percent linearity.
- Calculate R sq. Value.
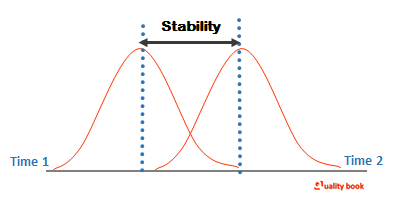
Stability
Stability measures system perform for particular time slot or whole the time. Its describe by control chart, how accurately system perform. And with total variation acquired with a precise instrument, on with same item / part when measuring a single characteristic completed period.
Stability is the total variation in the measurement system’s bias over time on a given instrument or master instrument. When more than one measurement system is involve. The one with the smallest system bias is consider the preferred stable system.
Gage Stability
- Typically, not as large a problem as R & R.
- Useful to help determine / and evaluate calibration intervals
- Useful for determine most stable system when more than one measurement system measures the same master part with significantly higher variation in bias over time.
Effects on gage stability
- Time – long idle periods or intermittent use.
- Very large or vary small number of measurements taken between stability tests.
- Environment or system changes, like humidity, air pressure.
- Potential confusion with statistical stability factors, such as warm up effects, rate or wear, lack of maintenance, untrained operators or laboratory technicians.
Cause of gage stability error
- Infrequent calibration.
- Oxidization (Corrosion).
- Lack of air pressure regulator or filter.
- Warm-up period for electronic or other gauges.
- Lack of maintenance
Gage Stability Work Instruction
- Take sample and create its master value relative to traceable standard; find as master sample for stability analysis: (1) If not possible, select production part in mid-range of process or tolerance (2) Best practice to include samples at the low, mid and high range – requires you to chart / track all three categories.
- Measure master(s) five to six times at different time of the day as per frequency decided (Weekly or monthly), at least 25 subcategories within the existing calibration frequency.
- Plot data on X-bar and R control chart / Or X-bar and S chart
- Evaluate as per normal statistical process control requirement with due considerations.
- Monitor these charts frequently to decide whether the gage needs to be calibrated.
- Compare standard deviation for measurements with process to determine suitability for the application.
(B) Precision
Precision show the variation; you see when you measure the same item repeatedly variation that occurs with the same instrument. It is mainly evaluating in two components or elements are: (1) Repeatability (2) Reproducibility.
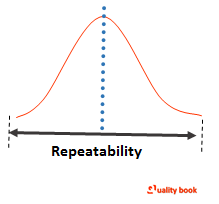
Repeatability
The variation occurred due to the measuring instrument, and its repeatedly measured by same operator with the same part repeatedly, it is called EV (Equipment variation). Variation is considered when the random variation in measurements are observed with one operator conduct the measurement with same gauge to measure the same part several times it is repeatability.
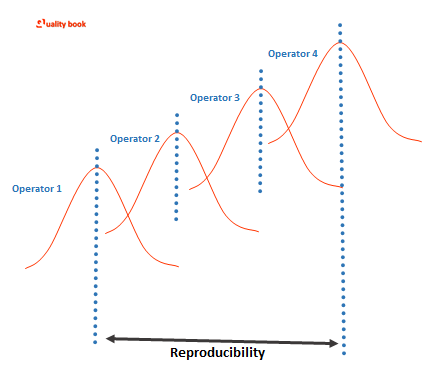
Reproducibility
The variation occurred due to the measurement system, the variation observed with different operator’s measurement with the same item and same instrument / Gage. When multiple operators measure the same characteristics on the same item / part it called AV (Appraiser variation).
Gage Repeatability and Reproducibility | Gage R & R
What is Gage R & R? or
what is gauge repeatability and reproducibility study?
Gage R & R (Repeatability & Reproducibility) is measurement system analysis method that conducted for analysis to evaluate the level of variation in a measurement system, and determining if the evaluated measurement system is adequate for practice.
Once the measurement system is identifying sustainable. It should ensure that it continues to be reliable as well as dependable when the measurement system established as formal system.
Gage R & R: Pre-Study
Why?
Determine the precision of the system, instrument, device or Gage – where precision = measurement error = Repeatability
How:
- – Repeatedly measure the same item.
- – Same conditions, operator, device and location on item.
- – Completely mount and dismount item for each measurement – exercise gauge through full range of normal use.
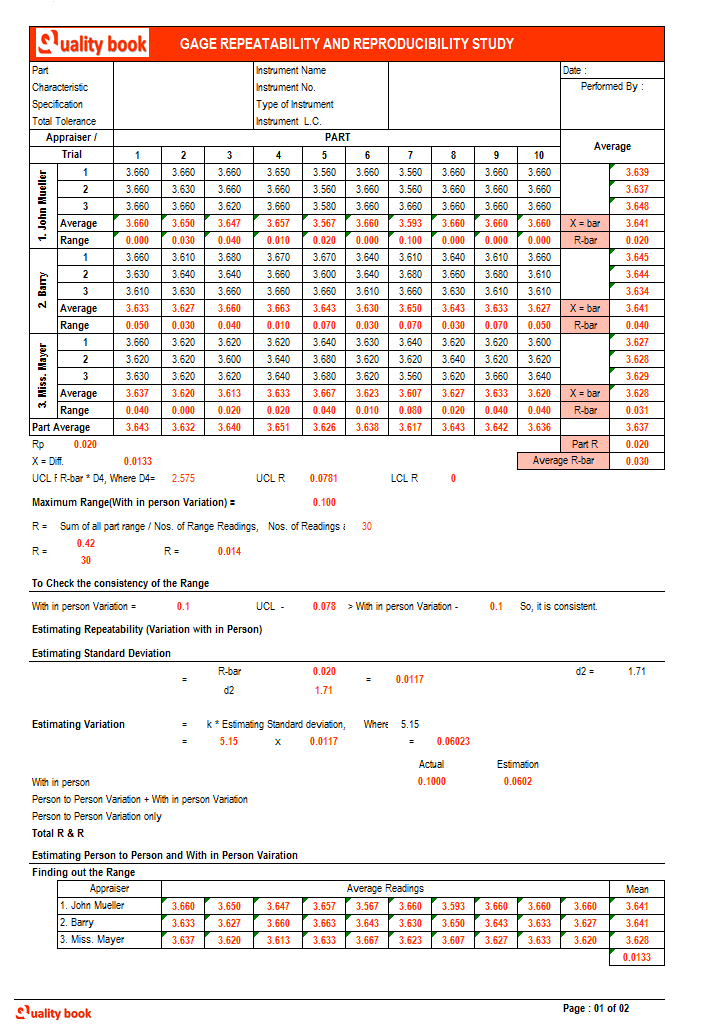
Gage R & R Study
To conduct Gage Repeatability and reproducibility, needs to understand the range method; range method is quick approximation of measurement variability, it will provide only overall variability of measurement system variation.
The method uses quick check to verify whether the Gage repeatability and reproducibility has not changed. It has potential to detect unacceptable measurement 80% of times when 5 item are used and 90% of times when 10 items are used. Before the conducting full phase measurement system analysis study, you have to review the checklist to ensure the system requirements, study requirements and easier for focus on objectives of the study.
(MSA) Measurement system analysis checklist
| CHECKLIST | EXPLANATION / WHY THIS QUESTION? |
|---|---|
| In organization, what is the measurement procedure (s) are used? / or SOP, Briefly Describe the measurement procedure / SOP, what standards applied? / or are used? | Measurement system analysis and data validation is the main objective of the process, there is many tools and methods are used for it, gage R & R is one of important tool but not just one. |
| What is the measurement error / Precision of the system? and how has precision been determined? | You also have to focus on standard deviation, type of repeatability in the whole system, and scatter monitoring. |
| What does the measurement system supplier state is the device’s (1) Precision (2) Accuracy (3) Discrimination? | Before start any study, you have to verify listed issues with gage, and measurement error. The gage / instrument supplier’s focus area can be varying; you have to determine it. |
| What study results you obtained from test-retest study and gage R & R study? | It is also important to validate currently available data from existing records, before conducting new study or add-on study. |
Conducting Gage R & R Study
- The collection of data should be collect as per communicate the data collection plan. As well all the collection process should be calculate the cost by appropriate method in expect time frame.
- Train employees on the collection of data plan for operational. Measurement tools as well as checklists and procedures to systematic and precise collection.
- Estimate the variation in the real measurement system by conducting actual processes. By peoples usually conduct measurements, performing the measurement study in the usual environment and use the gauges generally in tasks.
- Keep in the mind the variation comes into the measurement process from one or more elements like operator variation, Gage variation, part variation or method variation its equipment variation, and the source of variation from the through process such as different item configurations, checking methods, and appraisers are considered as appraiser variation.
- Identify the characteristic on the unit to be measured, the Gage and operators. Select two to three appraisers who are users of the measurement system.
- Identify number of units, usually a ten items that represent actual / expected range of process variation.
- Conduct Gage repeatability and reproducibility in the environment where the measurement proceeds.
- Calibrate gage, if this is item of the normal gauging procedures.
- The test should be randomized, Measure 10 items in random order by appraiser, with an observer recording results, mean first appraiser measure the all ten item in a random order, same procedure followed by second and third appraiser and measure units in random order.
- Calculate the variations and gage response using multi variation chart. The calculate range and average range, Calculate Gage R & R.
Calculate %EV, %AV, and % R & R against TV / tolerance based on the following table:
| CONDITION | GUIDELINE |
|---|---|
| TV > Tolerance | Compare against tolerance. |
| TV < Tolerance but measured parameter /ms is not required for statistical process control study | Compare against tolerance. |
| TV < tolerance and parameter is under Statistical process control study | Compare against total variation. |
Define the acceptable criteria based on estimated values of repeatability & reproducibility of system.
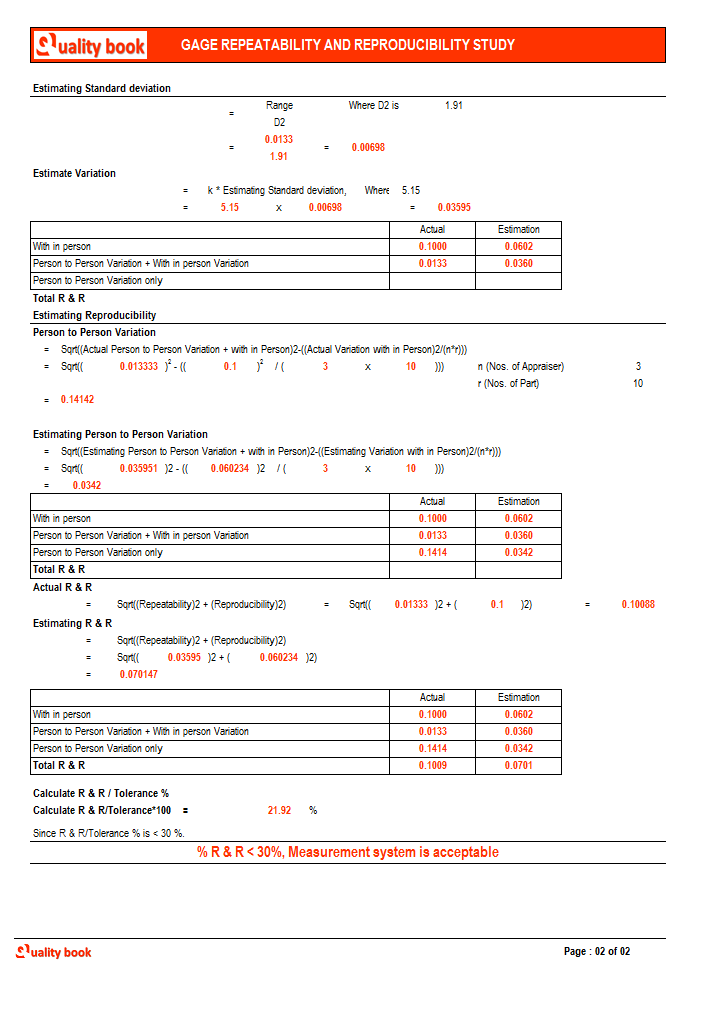
Analyzing Gage R & Results
- (1) if # R & R < 10%, system is acceptable.
- (2) if 10% R & R < 30%, system may be acceptable based on important of application, cost of gage, cost of repair, etc…
- (3) if % R & R > 30%, system needs improvement. “not Acceptable”.
Repeatability versus reproducibility
| WHEN REPEATABILITY IS LARGE COMPARED TO REPRODUCIBILITY | WHEN REPRODUCIBILITY IS LARGE COMPARED TO REPEATABILITY |
|---|---|
| Instrument needs maintenance. | Appraisers need better gage use training. |
| Redesign Gage for more rigidity. | Need better operational definition. |
| Improve clamping or location of gauging. | Incremental divisions on instrument are not readable. |
| Excessive within – part variation. | Need fixture to provide consistency in gage use. |
Gage R & R Graphic Analysis
Range control chart for repeatability, from Statistical process control chart. Control limits from range chart (R-chart*) are: <1> UCL = D4 * R bar <2> LCLC = D3* R bar, D3 and D4 are estimated from control chart constants.
Average Control chart for reproducibility, from statistical process control chart, control limits for average chart (X – bar Chart) are: <1> UCL = Grand average + A2* R bar x LCL = Grand average – A2* R bar
| CONDITION | INTERPRETATION |
|---|---|
Range Chart Conclusion | |
| One or more than one point of one appraiser out of UCL R. | Appraiser’s method is different from others. |
| One or more than one point of all appraisers out of UCL R. | Measurement System is sensitive to appraisers skill. |
| In one part all appraiser’s points are out of UCL R. | Item is deformed or Damaged. |
Average Chart Conclusion | |
| More than 50 % of readings are out of control limits. | Measurement system is adequate enough to capture process variation. |
Conclusion:
Measurement system analysis applications
- Establish criteria for suitability and acceptability of new measuring equipment.
- Compare performance of equipment before and after its repair.
- Compare one measuring device against another.
- Evaluate suspect equipment.
- Manage & improve measurement process.
Measurement system analysis (MSA) having a major part of gage R & R study. Because the Gage R & R study helps to improve precision in measurement system. The whole measurement system analysis (MSA) process conduct as tool use to evaluate the numerical or statistical properties of process measurement system.
Generally, MSA is to statistically validate that current measurement system to verify representative values of characteristics being measuring and unbiased results to identify and minimize variation. Now days, to consider serious needs to measurement system analysis for organization. ISO / TS 16949 standard which use in automotive industry had measurement system analysis made mandatory requirements.