Whenever we have to make an experimental design, two main issues are important to any business, one is to reduce the number of samples and to manage the costs systematically. Also, all the necessary information should be available in proper proportion. It requires an optimal design that ensures adequate sampling by minimizing the number of locations needs at the DOE. As well as indicating which sampling point information to use in order to proceed.

As you can imagine, Design of Experiments (DOE) is a powerful collection of data. Which can be analyze to identify factors that can affect the results we need. Also, can anticipate situations, establishing systems for outcomes as needed.
A Plan of Experiment (DOE) is useful for a planned and structured system. It helps to find the relationship between the factors, which can affect the results of a task. like:
- X-Variable – can find correlation between factors, which
- Y-Variable – which are the results of functions, which are affected by various factors.
Design of Experiments (DOE)
1 » What is Design of Experiments (DOE)
2 » When should we use design of experiments?
Using this to conduct business deterministic experiments, the results of the experiments are analyzed to find the factors that have the greatest effect on the results and the best conditions are classified.
What is Design of Experiments (DOE)
As you know, Design of Experiments (DOE) is a systematic method that examines the relationships, causes, and factors affecting the results of the processes that take place between the materials introduced at the beginning of a process and the results at the end of the process. determines the at the end of this experiment [perhaps the number of experiments can be 5, 10 or more times] the team collects and analyzes the necessary data. Which is difficult without DOE. So, what is DOE in reality?
“Design of Experiments (DOE) is a statistical technique, established as analytical and evaluative, used by a business to optimize reactions and processes in its manufacturing processes. DOE plans for experiments to evaluate factors affecting parameters to ensure optimal values, including all necessary processes from planning.”
As you know, planning is an integral part for production, as well as for experimentation it is necessary to successfully complete its pre-planning, which is key to research, analysis and selection of best values. But naturally, the question arises, what will be seen in the design of these experiments?
How to conclude? the information for that is given below:
- A study can determine the number of explanatory variables used in an experiment, which may be one or more, and their status.
- Statistical data can also be collected to determine whether the number of levels of the independent variable changes or remains constant.
- After analyzing the data, it is very important to know the additional or disturbing factors in the processes, the development of methods to control the variables and where and how they should be applied. In particular, known additional variables can be directly excluded by the method of direct control. If it is impossible to exclude known additional variables by the alignment method, the method of “randomization” allows for random selection of groups in case of uncertainty of additional variables.
In particular, through this design it can be understood, in what order the changes in the independent variables that affect the dependent variable should occur, and how to present the influencing factors so that a reduction in sensitivity can be recorded.
When should we use design of experiments?
Design of experiments can be used when we feel that an internal or external factor can influence the final stage of the production process, or even the results of the process, such as air, water, moisture, precipitation, and heat on wood products. Effects of natural or man-made factors can be understood using experimental design.
Design of experiments is also useful because, through it, we can get the necessary information by doing all the important experiments. Also, such studies can be conducted in less time and less time and the results are technically simple and appropriate. Which are as follows:
- Makes it possible to shorten the product development cycle.
- It becomes possible to study the production process more deeply in less time.
At the same time, it should be understood that when the manufacturer wants any innovation in the product, it is necessary to experiment. “Innovation is impossible without experimentation.” Therefore, it is necessary to confirm the relationship between its excellent design and the results obtained with the materials, resources, processes and manpower used for the product.
How to design experiments.
When you create a DOE for a product, first we have to focus on the flow of production processes and process maps. Because, without understanding the process flow for making DOE it is difficult to make it correctly.
To create a DOE, we first have to understand what is added to the production processes, i.e., the inputs – goods, materials, processes, resources, manpower etc.., and what will be obtained at the end of the processes – which will be the output. In particular, information is written on flowcharts and maps of the flow of all these information processes. At the same time, it is also necessary to understand that what is the exact measure of the result obtained at the end of the process? It should be preferable. Ensure that the system of measurements is accurate and stable.
Here we have made a table to understand all these things. In which we show data and statistics for example, for possible factors – to create all possible combinations of high and low levels, high and low levels are shown as +1 and -1.
Sample Table:
| FACTOR NAME | FACTORS | LOW SETTING | HIGH SETTING |
|---|---|---|---|
| Temp | FT – A | 24 | 38 |
| Moist | FT – B | 9 | 18 |
| Cycle | FT – C | 8 | 14 |
As you can see above, the table shows the factors affecting a wood product. Where, temperature, humidity and production cycle are the main factors. Also, those factors are coded as A, B, and C, respectively. A number of low and high settings are also given.
Example
For example. here we will understand the example by taking sample statistics for each of the factors.
| JOB ID | TEMP | MOIST | CYCLE | FT – A X FT – B | FT – A X FT – C | FT – B X FT – C | FT – A X FT – B X FT – C | TRIAL 1 | TRIAL 2 | TRIAL 3 | TRIAL 4 | TRIAL 5 | AVG |
|---|---|---|---|---|---|---|---|---|---|---|---|---|---|
| SO8 | 24 | 9 | 8 | 1 | 1 | 1 | -1 | 13.9 | 12.1 | 13.5 | 12.5 | 11.5 | 12.7 |
| SO2 | 24 | 9 | 14 | 1 | -1 | -1 | 1 | 12.5 | 12.2 | 13.7 | 11.2 | 12.5 | 12.42 |
| SO4 | 24 | 9 | 14 | 1 | -1 | -1 | 1 | 11.5 | 12.3 | 11.5 | 13.5 | 12.5 | 12.2 |
| SO5 | 24 | 18 | 14 | -1 | -1 | 1 | -1 | 13.2 | 12.4 | 13.6 | 11.2 | 12.5 | 12.58 |
| SO1 | 38 | 9 | 8 | -1 | -1 | 1 | 1 | 11.2 | 12.5 | 13.5 | 12.5 | 12.5 | 12.7 |
| SO9 | 38 | 9 | 14 | -1 | 1 | -1 | -1 | 12.5 | 12.6 | 12.7 | 12.6 | 12.4 | 12.56 |
| SO11 | 38 | 18 | 8 | 1 | -1 | -1 | -1 | 13.8 | 12.7 | 13.3 | 11.5 | 12.5 | 12.76 |
| SO16 | 38 | 18 | 14 | 1 | 1 | 1 | 1 | 14.2 | 13.1 | 13.2 | 14.3 | 14.5 | 13.86 |
In the above table we can see that there are statistics given for example. Where temperature, humidity and cycle are shown for each job ID. Also shown are the low and high settings of each factor, the multiplier of the statistic, and the five attempts.
At the end of which the average score is calculated. As you can see, for each job there will be eight combinations with random order. The result of which is measured.
What is the method?
In fact, this is an experiment, in which production processes are run with different factors. As here, we will examine the effects on the product based on temperature, humidity and process cycle.
As we can see in the above table the average is calculated against each job order. That average can be calculated for the high and low levels as:
For FT-A:
High Level (+1) = Mean (12.44 x 12.56 x 12.76 x 13.86) = 12.905
Low Level (+1) = Mean (12.7 x 12.42 x 12.2 x 12.58) = 12.475
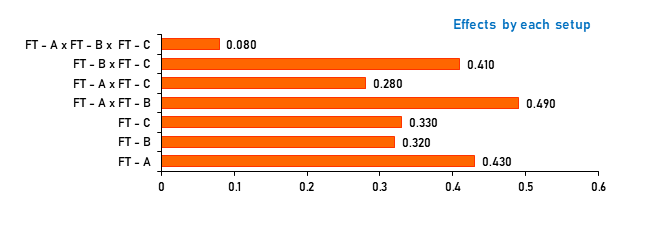
Effect = 12.905 – 12475 = 0.43
Thus, a graph can be prepared according to the number of effects of each.

Here we look at the graph and it becomes easy to identify the factors affecting the production processes. This makes it easier to determine which interaction effect is larger. So, the effect of effective factors can be reduced by making excellent settings.