In today’s economic environment, every business having a tough competition with similar products manufacturers. Now days drastically required to organize manufacturing activities to produce very competitive prices and services by dedicated continual improvement. The organization must confidently use more efficient manufacturing processes to produce products with effective costs, these products and services must satisfy customers by in value and technical required terms.
To achieve stable product quality needs to everyone committed to continual improvement by use of effective techniques. In this article I will try to describe basic methods of statistical use in analysis on collected data from manufacturing processes. Here on qualitybook.org, we tried to including all the possible methods and required analysis documents such as control charts, quality function deployment, check sheets, flowcharts, Pareto charts, etc… So, let’s see how to implement SPC in organization.
What is Statistical process control (SPC)?
“Statistical process control (SPC) is a Process to determine the appropriate statistical technique to enhance visibility to quality information of product characteristic and process capability. “
Statistical process control (SPC) is a process to determine the appropriate statistical methods including monitoring, measurement, analysis and improvement to increase the visibility to quality information of process capability and product characteristics at control plan during implementation of advanced quality planning. The personnel involve in this particular process should utilized and understand the basic concepts such as variation and stability control.
Generally, in organization, statistics tools are used to make predictions on performance of manufacturing processes by number of simple techniques for analyzing data and, if applied correctly, can lead to predictions with high degree of accuracy.
Why SPC?
In the lower production expenditure, much more production and higher quality products are extremely important in today’s economic scenario, which can be achieved through out-of-turn changes and positive strategies in production processes. We have to examine every single production processes with scientific and modern technologies. So that we can accurately assess the variation in production.
Fortunately, from statistical process control (SPC) we can draw the attention of each and every quality of production form the right criteria. To make it consistent to eliminating the difference within the process and get identification of proper way to achieve better quality product.
Statistical process control (SPC) Process Flow: Table
| WHAT RESULTS (PROCESS INDICATORS) | BY WHAT? (EQUIPMENT, MATERIALS) | INPUTS | BY WHOM (PERSONAL) | HOW? | OUTPUTS |
|---|---|---|---|---|---|
| Quality Objective: No. of Ppk < 1.33 Reported on process control ( As you generally indicate) | Equipments: Testing & Measuring Equipments, Computer soft wares Materials: Sampling Parts to be measured & SPC control chart | Manufacturing / Production process that need to statistically monitored as per customer request | Personal in charge – As Per Defined Quality assurance & Production organization chart, qualified in process / product knowledge. | Statistical process control (SPC) guidelines, manuals | Manufacturing / production process is table with SPC control chart used. |
Process Control
The process control, controls on the involved all the major elements of process such as man, machine, materials, management and methods and analyze outputs to verify and analyze. As well measure & feedback to increase productivity and effective control on processes. This process use control on variation in the outputs of the processes, generally variation is natural manner in processes hence needs to be controlled in order to ensure that final product is meeting the customer requirements.
OK, but how to ensure that the process is fully control?
Answer is”A process in control is in the ideal state fully conforming & predictable, where all the operations, product’s specified tolerance are stable and consistent”.
To consistent process control having a two major tools are detection & prevention, both are also knowing as waste reduction techniques because directly and indirectly its control on waste which is generates from various processes so, let’s discuss in brief.
Tools for Process Control
- Detection (tolerates Waste): Detection focuses on identification of defects, problems in product after production completed, by inspecting, measuring or by customer complaints. Generally, detection or production defect identify on after complete of production processes during inspection processes. In short, Detection is an approach that attempts to identify unacceptable final product after it has been produced and then separate it from produced products lot or batch.
- Prevention (Avoids waste / eliminate, reduce possibility of waste): Prevention process tool used and focuses on in-process or before production start, and identification of product defect / problem concluded study of process capability. In short, Prevention is a future oriented approach by study and action toward correcting the process itself. So that intolerable products will not be produced. Generally, most organization are focus on prevention because it is improved design & process capability, product quality and continual improvement.
Detection vs Prevention
| SR.NO | DETECTION | SR.NO. | PREVENTION |
|---|---|---|---|
| 01 | The process conducted on completion of manufacturing processes to identify and improve the defects. | 01 | The process conducted on before / or in-process to prevent the defect for producing products. |
| 02 | Detection is quality control tool or method use to verify the quality as per product standards and customer requirements. | 02 | Prevention is actually, technique of managing quality, mean its analyze information to identify of problems. |
| 03 | Detection is results of action for performed the planned processes. | 03 | Prevention is results of planning for conducting manufacturing processes. i.e. planning of processes, bill of materials management, work instruction setup etc.. |
| 04 | Detection focus on identification of defects in products, after production processes are already done. | 04 | Prevention also focus on identification of problems but, focuses on in-processes or before manufacturing / production processes. |
| 05 | In Detection strategy there is no way to improve processes because production is already done. | 05 | Hence, in prevention strategy, there is huge chance of improving design and process capability. |
| 06 | As results of detection in products during inspection, rework, and re-inspection impact negative costs increase. | 06 | As results of prevention in-process, design, processes change and monitoring cost impact costs, but overall its benefits for future product development. |
| 07 | Repetitive problems in manufactured products | 07 | Identify before tasks perform in production planning. |
Variation
If you want to effectively implement process control in manufacturing processes, you really have to understand variation in collected measurement data from various processes, because variation in any process is natural and obvious It is very difficult to produce consecutive product which are identical in appearance and measurements with perfect dimensions, differences may be large or very small, but they are always there and the differences we knows as variation, this is the reason why tolerances are used. Mostly natural variation that is also called common causes are the many sources of variation that are always occurred in production processes. Some examples of variable are as below:
(1) Materials: Dimensions, composition, hardness;(2) Machine: Operating temperature, Speed, feed rate, Clearance;(3) Tools: Shape, Wear rate, Strength;(4) Operator: Setup choice, fatigue, accuracy;(5) Maintenance: Calibration, Lubrication etc.;(6) Environment: temperature, Humidity etc.;
Variability is inherent in every manufacturing processes in form of natural or common causes and / or special causes, because of every operator working style, behavior and habits are different and as described above the reasons are common for every variation occurred in processes. The two kinds of variation that we are concerned in are common cause and special cause variation.
Common Cause:
Every manufacturing processes have variation is called common cause variation. A manufacturing process is supposed to be in control, if it displays only common cause variation that is the process is completely stable and predictable. This type of variation in the production processes are common and expected, final products measures monitor a possibility spreading and for any distribution there is a measure of central tendency and dispersion.
Special Cause:
Variation that can be identified and traced to a specific reason such as machine wear, wrong adjustments of equipment, fatigued or human error due to untrained workers. You have to need identify when special causes are present and eliminate them. In special cause we can see that every variation identify as results of unexpected events or unplanned situations.
Process control chart
“Process control charts display the variation in a measurement during the time period that the process is observed”
The statistical process control charts are one of the unique way to identify between common and specific causes types of variation. The process control charts can be applied any type of processes that can be dynamic and static processes. See Example of process control chart:

If the special cause / assignable cause is identifying in the existing processes that results from production is not stable over time and is not predicable. The process control charts’ advantage is differentiating between natural variations and variations due to special causes.
Control charts are an important graphical / visual tool to identification & monitor processes to display and measure, how the manufacturing processes are performing and how the manufacturing processes and capabilities are affected by changes to the manufacturing processes. And those analyzed information helps to improve and maintain quality. Process control chart is also used to determine the process capability and identify special and common causes for reasons that block highest performance.
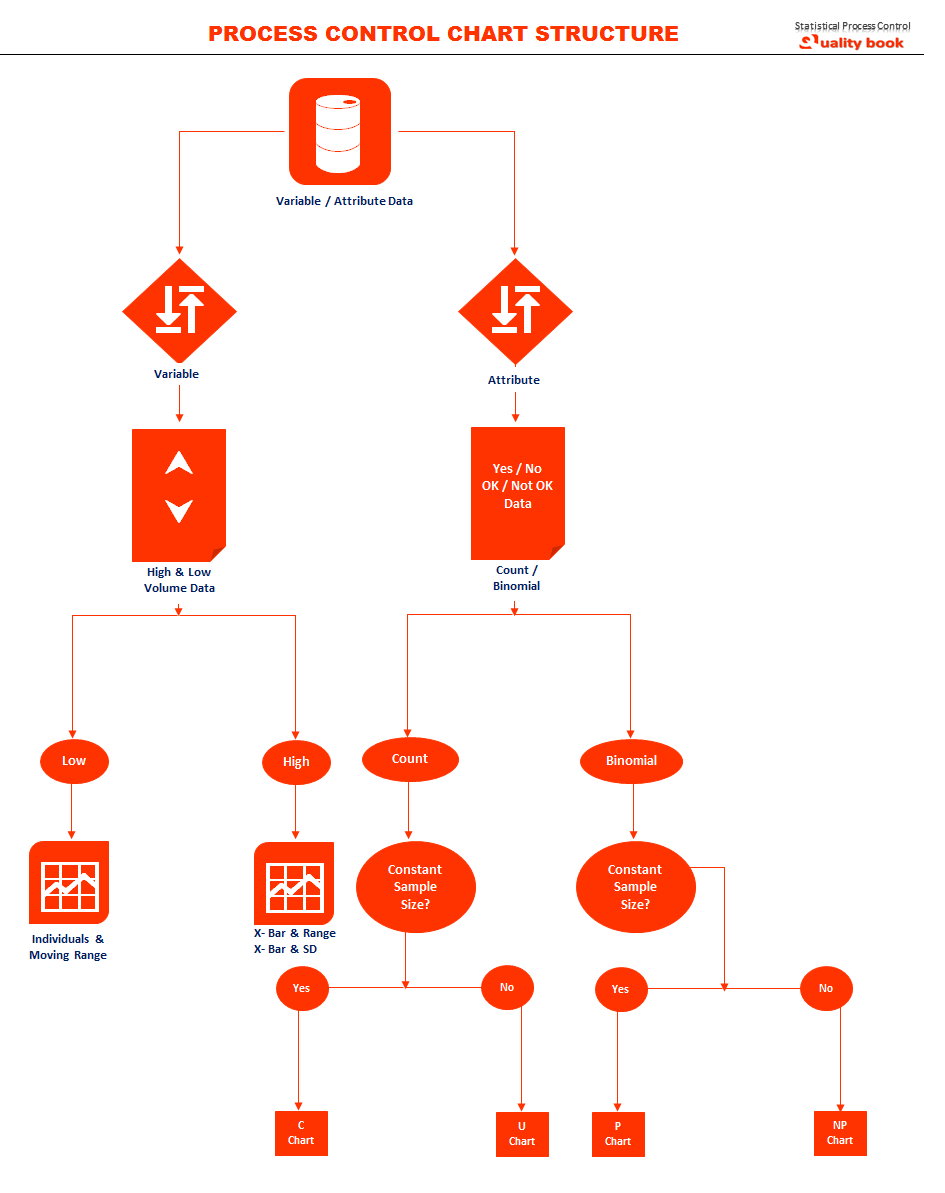
Type of data for statistical process control
Any facts or numbers or observations made. Set of observation forms the data. Types of data – variable data and attribute data. Variable data generated by physically measuring the characteristics using a tools and transmission a unique value to each material. The attribute data generated by classifying the material into different groups based on some criteria, no physical measurement is involved and all the things classified into a group will have same value (OK or not ok)
Various Types of Variable Control Charts
- X bar & R control chart
- X bar & SD control chart
- Run chart – not really a control chart
- Individual Moving range control chart
- Median and Range control chart
- Cumulative sum control chart
Various Types of Attribute Control Charts
- p chart
- n p chart
- c chart
- u chart
The statistical process control (SPC) charts are simply visual tools. That facilitate manufacturing activities and processes performance observation. It is planned to detect, which type of variation occurs within the manufacturing process. Organized to highlight location or particular area that may require further investigation and easy to create and construe. Generally, in present industry, two major statistical process control tools are widely used are run chart and the control chart.
Both are easy to collecting data from production and draw in simple excel sheet too easy to interpret with follows some basic rules in order to identify the variation type without the need to much effort about the fundamental statistical theory.
X – Bar R chart (Average and range charts)
Summarized points:
- Identify the manufacturing process to be control;
- Identify variable Parameter;
- Ensure measuring instrument capability;
- Decide the subcategory – sample size of the Variable Process Parameter;
- Decide the sampling plan using check sheet;
- Plot the control chart and take actions based on control chart.
X and R Base.
Average and range chart i.e., X-bar R chart is a widely used tool for manufacturing processes monitoring in the various industry. The control charts are basically plot of the process results data over time.
Before a control chart may be use in manufacturing process analysis. The process owner must ensure that the manufacturing process to be observed in standard and constant.
It is very important to establish suitable environment, before x and R chart be used.
Process Relationship.
Before b and R charts can be used the manufacturing processes should be defined.
You must be understood of its relationship to other operations and basic processes components:
Such as man, machine, materials, method, environment etc.
That can directly or indirectly affects manufacturing processes at any movement and phase. Identify those differences in manufacturing processes needs to conduct process flow diagram and cause and effects diagram to show variations causes at appropriate reasons.
Determine characteristics & Measurements.
It is important to determine characteristics to be charted. Such as customer’s requirements, significant issues in existing processes and areas, and relationship between characteristics to effectively analyze information through control chart. The characteristics should be operationally defined to maintain constituency of process characteristics. Each measurement equipment should be properly calibrated as per its schedule, and must be predictable for accuracy and precision.
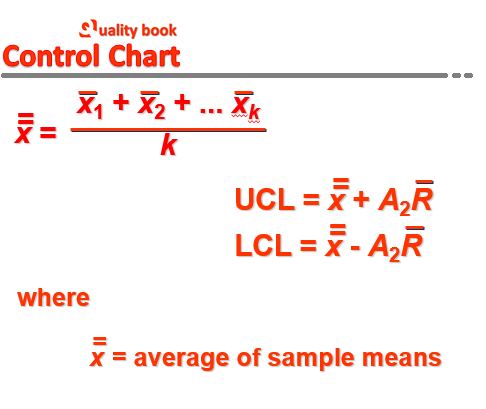
Chart Limits Setup
For x̄ -Charts when we know σ
Upper control limit (UCL) = x̄̄ + z σx̄
Lower control limit (LCL) = x̄̄ – z σx̄where,
where x̄̄ = mean of the sample means or a target value set for the process
z = number of normal standard deviations
σxσ = standard deviation of the sample means
= σ/ √n
s = population standard deviation
n = sample size
X – Bar Chart
X – Bar Chart : Data ::
| SAMPLE K | 01 | 02 | 03 | 04 | 05 | X | R |
|---|---|---|---|---|---|---|---|
| 01 | 8.02 | 8.01 | 6.94 | 6.99 | 6.96 | 7.38 | 1.08 |
| 02 | 8.01 | 8.03 | 8.07 | 6.95 | 6.96 | 7.60 | 1.08 |
| 03 | 6.99 | 8.00 | 6.93 | 6.92 | 6.99 | 7.17 | 1.08 |
| 04 | 8.03 | 6.91 | 8.01 | 6.98 | 6.89 | 7.36 | 1.14 |
| 05 | 6.95 | 6.92 | 8.03 | 8.05 | 8.01 | 7.59 | 1.13 |
| 06 | 6.97 | 8.06 | 8.06 | 6.96 | 8.03 | 7.62 | 1.10 |
| 07 | 8.05 | 8.01 | 8.10 | 6.96 | 6.99 | 7.62 | 1.14 |
| 08 | 8.09 | 8.10 | 8.00 | 6.99 | 8.08 | 7.85 | 1.11 |
| 09 | 8.14 | 8.10 | 6.99 | 8.08 | 8.09 | 7.88 | 1.15 |
| 10 | 8.01 | 6.98 | 8.08 | 8.07 | 6.99 | 7.63 | 1.10 |
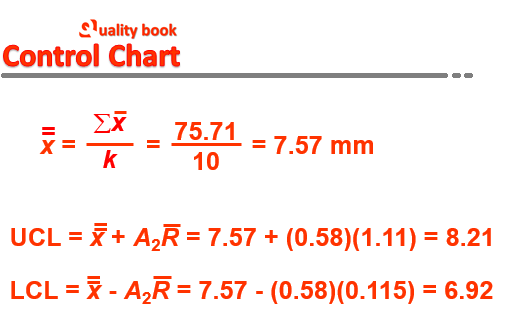
| Total | — | — | — | — | — | 75.71 | 11.11 |
R – Chart
UCL = D4R̄
LCL = D3R̄R̄ = ∑ R / k
Where,
R̄ = range of each sample
K = number of samples
Formula,
R̄ = ∑ R / k = 11.11 / 10 = 1.11
UCL = D4R̄ = 2.11(1.11) = 2.34
LCL = D3R̄ = 0(1.11) = 0.00
Prepare R – chart as per x bar chart example described above with given table as above.
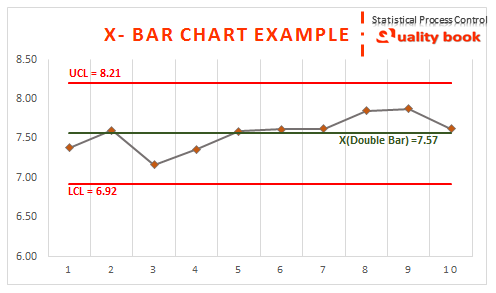
Analysis
For example, any measurement shows outside the control limits is a cause for alarm. Analyze above chart and data plotting control chart and draw conclusion, if specification is plus or minus as per center point i.e. control limit. The control charts limits are automatically display and calculate from the data produce by the manufacturing processes. These outputs data are complete control chart display to calculate as per standard formulation which results process voice.
When the ranges are in statistical control. The process range – the within subgroup variation is consider to be stable. If the manufacturing processes area us moving over time, the averages can then be analyze. The averages are not in control, some special causes of variation are making the process area unstable.
If the one or more points beyond control limits, and initial causes are identify as special causes at the point. The manufacturing processes must be immediate analysis of the operation is require, and you have special marks on those points.
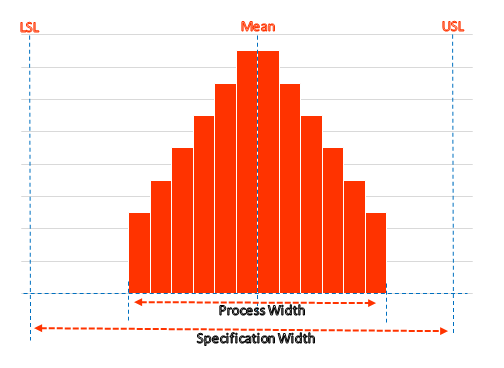
Process capability & Process capability index
A methodology to check whether the process shave the potential to meet the customer requirements. Generally, customer requirements are give as specification on product characteristics such example. Specification on steel tube thickness on drawing process should must within 1.55 +/- mm.
Process capability states to the capability of a process to meet customer requirements or specification limits. Mean how consistent it results is in being within its upper specification and lower specification limits.
Why process capability study & index?
- Increase process capability using statistical process control tools and six sigma approach.
- To aware current process capability for design & capability to meet customer specification.
- It is also helpful even, for non-manufacturing processes like marketing and accounting etc.
- Capability indices based on mean and SD for process data: Cp & Cpk.
Process capability analysis used to fine-tune the process until practically all of the product results meets the specifications. Once the process is operating in control, capability analysis attempts to answer the question; is the process’s results meeting specifications or process is capable? If not identify, the process must be adjust to make it capable.
Formula:
CPL = (mean – LSL) / (3 sigma) : process capability index for single-sided (lower) spec limit
CPU = (USL – mean) / (3 sigma) : process capability index for single-sided (upper) spec limit
Cpk = min{CPL,CPL} : process capability index for two-sided spec limits
Process Capability Index
(A) Cp & Cpk > 2.0 (Z > 6)
| (B) Cp & Cpk > 1.67 (Z > 5)
| (C) Cp & Cpk > 1.33 (Z > 4)
| (D) Cp & Cpk < = 1 (Z > 3)
|
Conclusion:
On base of this article, now you have the basic fundamentals of statistical process control. You should understand that it measures variance. It is use to conclude, if a process is in control. And different steps necessary in performing statistical process control. It also includes problem identification, data gathering, prioritization and analysis.